Acuity Inc. ($AYI): Behind a 46% EPS Pop, Organic Growth Is ~2% and Core Lighting Is Quietly Shrinking
The 46% jump in diluted EPS masks that nearly all the top-line 'growth' came from lapping the QSC acquisition and from buybacks — on a comparable pro forma basis revenue rose only ~1.8% and the core lighting business actually shrank. The durable engine here is margin expansion and capital return, not unit demand.
AYI
10-QNeutralAcuity Inc.
The 46% jump in diluted EPS masks that nearly all the top-line 'growth' came from lapping the QSC acquisition and from buybacks — on a comparable pro forma basis revenue rose only ~1.8% and the core lighting business actually shrank. The durable engine here is margin expansion and capital return, not unit demand.
⚠ Major Risks
- •Soft core-lighting demand: the ABL segment (~77% of sales) declined ~1% YoY and its Direct sales channel fell ~23% over nine months, leaving growth dependent on the acquired AIS/QSC business.
- •Tariff exposure and uncertainty: the company paid IEEPA-based import duties in fiscal 2025–2026 and treats potential refunds as unrecognized gain contingencies, so timing and amount remain uncertain.
- •Acquisition/impairment risk: the $1.2B QSC deal added $394.6M of goodwill and $713.9M of intangibles concentrated in the AIS segment; underperformance could force a write-down.
- •Inventory obsolescence: management warns that a significant shift in customer demand, market conditions, or technology could render inventory obsolete and materially hurt results.
- •Warranty and litigation exposure: standard product warranties of up to five years, plus patent, employment, and product-liability claims, could exceed accrued amounts.
🔍 Accounting Red Flags
- ▲Headline growth is acquisition-inflated: the +59% nine-month AIS revenue jump and much of net-income growth reflect QSC being consolidated for nine months this year versus five months last year; on Acuity's own pro forma basis, comparable nine-month revenue rose only ~1.8% ($3,397.4M vs $3,337.2M).
- ▲Goodwill plus intangibles total $2.52B (~54% of total assets), leaving thin tangible equity, yet no interim impairment was recorded even as the core ABL segment shrank.
- ▲Reported gross margin was aided by a one-time $6.4M IEEPA tariff refund booked into cost of products sold.
- ▲Operating cash flow was flattered by a non-recurring ~$66.9M inventory drawdown (finished goods down ~20%), partly offset by an $82.5M accounts-payable reduction.
💰 Cash Flow Quality
Operating cash flow rose ~30% to $520.2M for the nine months and comfortably funded capex, heavy buybacks, debt repayment, and dividends.
- •Net cash from operations was $520.2M (vs $398.9M) against only $58.5M of capex, leaving robust free cash flow.
- •Free cash flow funded $229.9M of buybacks, a ~$200M net reduction in debt, and dividends, with cash ending near flat at $411.9M.
- •Quality caveat: D&A jumped to $117.8M (from $86.7M) on QSC intangible amortization, and the ~$66.9M inventory release was a one-time working-capital tailwind.
🏰 Competitive Position
A strong brand-and-distribution moat in lighting, augmented by an emerging building-technology software platform, but offset by a mature, competitive core market.
- +Market-leading lighting brand portfolio (Lithonia, Holophane, Juno, Gotham, nLight) and an entrenched independent sales-agency network.
- +Expanding AIS technology stack (Q-SYS, Distech, Atrius) with edge-plus-cloud network effects and recurring software/service revenue.
- +Scale-driven profitability: gross margin reached 50.6% with strong free-cash-flow generation.
- -Core lighting is mature and cyclical, tied to construction and renovation activity, and the Direct sales channel is declining.
- -Growth is heavily reliant on M&A (QSC), concentrating $2.5B of goodwill and intangibles on the balance sheet.
- -Exposure to import tariffs and component/commodity cost swings.
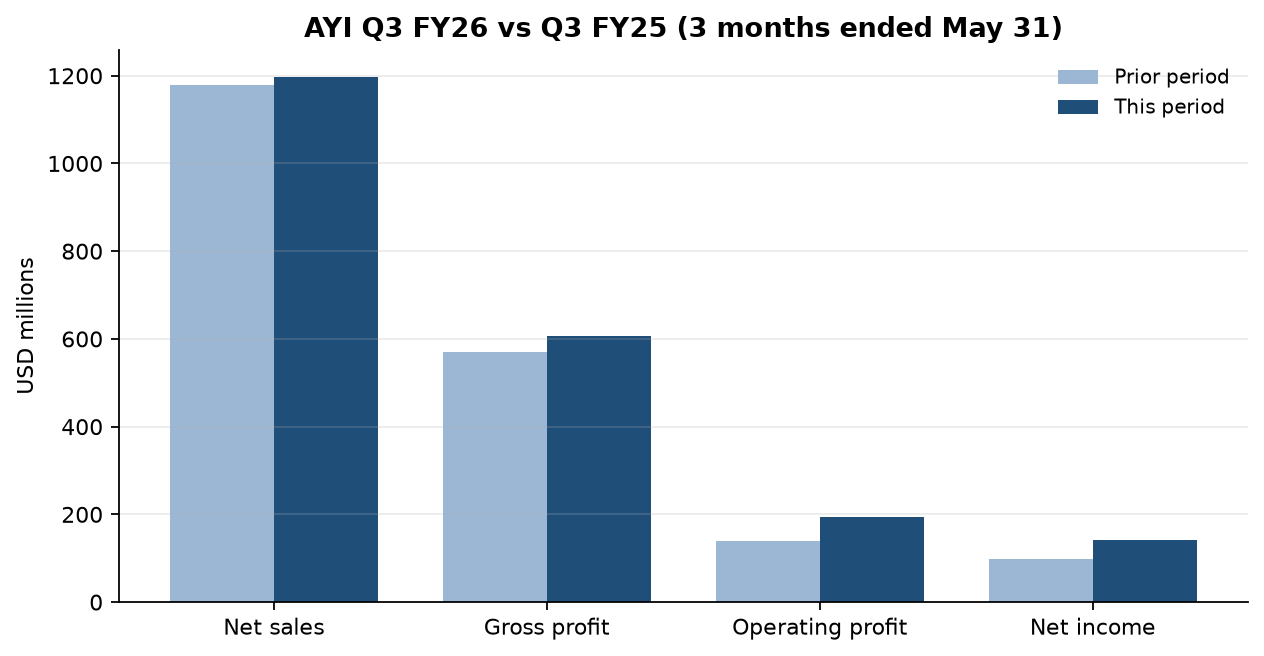
The tape reads like a blowout. Third-quarter net sales hit $1,198.0M, gross margin expanded to 50.6%, operating profit jumped 38% to $193.3M, and diluted EPS came in at $4.56 versus $3.12 — a 46% leap. Nine-month revenue is up 8.3%. On the surface, Acuity is firing on all cylinders.
Strip out the QSC audio/video acquisition (closed January 1, 2025 for $1.2B) and the picture changes. Acuity's own pro forma shows comparable nine-month revenue rose only ~1.8% ($3,397.4M vs $3,337.2M). The eye-catching +59% surge in the AIS segment is mostly QSC sitting in the numbers for nine months this year against five months last year. Meanwhile the core lighting business — ABL, roughly 77% of sales — shrank about 1%, with its Direct sales channel down ~23% over nine months. The EPS pop is margin and capital allocation, not demand: ~$36M of gross-profit expansion, the lapping of $29.7M in prior-year special charges, lower net interest after ~$200M of debt paydown, a one-time $6.4M tariff refund booked to COGS, and $229.9M of buybacks that shrank the share count.
In plain English, Acuity earned more per share by running leaner, deleveraging, and retiring stock — not by shipping materially more product. That is high-quality execution, but it is a more finite engine than unit growth. With goodwill and intangibles now ~54% of the balance sheet, the bet increasingly rides on Q-SYS and Distech (AIS) compounding enough to justify the price paid for QSC.
Watch two numbers next quarter: organic ABL volume (is the lighting core stabilizing or still leaking, especially the Direct channel?) and AIS revenue once the acquisition fully laps. If both stall, the margin-and-buyback lever has to carry everything — and the ~$66.9M inventory drawdown that flattered this period's cash flow will not repeat.
Want this on every stock you own?
Run instant AI analysis of any 10-K or 10-Q from EDGAR — major risks, red flags, cash flow quality, and moat — with Value of Stock Premium.
This analysis is generated from the filing text and is for educational purposes only — not financial advice. Always do your own research before investing.