Carnival ($CCL): Record Q2 Revenue, but H1 Profit Nearly Doubled on Lower Interest — Not a Better Cruise Business
Carnival's H1 net income nearly doubled, but operating income slightly declined — the entire profit improvement came from lower interest expense and the absence of last year's debt-extinguishment charge, while record revenue was eaten by fuel and labor inflation. The deleveraging and record $9B bookings are real, but the earnings growth is a balance-sheet story, not an operating-leverage one.
CCL
10-QNeutralCarnival Corporation Ltd.
Carnival's H1 net income nearly doubled, but operating income slightly declined — the entire profit improvement came from lower interest expense and the absence of last year's debt-extinguishment charge, while record revenue was eaten by fuel and labor inflation. The deleveraging and record $9B bookings are real, but the earnings growth is a balance-sheet story, not an operating-leverage one.
⚠ Major Risks
- •Heavy debt load — $25.6B total debt vs $13.0B equity, with debt-to-capital near the 65% covenant ceiling; cross-default/cross-acceleration clauses mean an event of default could make substantially all debt due.
- •Fuel cost volatility — Q2 fuel expense jumped 27% YoY to $595M; the company manages fuel only through consumption (no hedging program disclosed), so spikes hit margins directly.
- •Macro/geopolitical demand shocks — war, pandemics, inflation and higher rates could cut travel demand, the company's stated top risk.
- •Cybersecurity/data privacy — an April 14, 2026 data security incident has already drawn six consolidated U.S. class actions; ongoing breach and litigation exposure.
- •Foreign currency exposure — euro-denominated debt and euro-priced newbuild contracts; FX swung from a $227M translation gain in Q2 2025 to a $3M drag in Q2 2026.
🔍 Accounting Red Flags
- ▲Ship depreciable lives extended to 35 years and residual values cut (effective Dec 1, 2025) — a prospective estimate change management calls 'immaterial,' but one that structurally lowers future depreciation and quietly supports reported margins; a classic earnings lever to monitor.
- ▲Headline H1 earnings quality is weak: net income rose ~64% while operating income actually fell, so the gain is sourced below the operating line (interest expense down $141M; prior-year $255M debt-extinguishment charge absent) rather than from the core business.
- ▲Per-share comparability is muddied by ~5% more shares (69.1M issued on convertible-note conversions plus other conversions), which amplified the Q2 basic EPS decline beyond the net income decline.
💰 Cash Flow Quality
Operating cash flow of $3.9B (up 17% YoY) comfortably funds capex, debt paydown, a reinstated dividend and buybacks — but is seasonally flattered by a large customer-deposit inflow.
- •Six-month operating cash flow $3,893M vs $3,317M prior year, +17%.
- •~$1,660M of that inflow is the seasonal build in customer deposits (advance bookings) — a leading demand indicator but a working-capital tailwind that reverses as voyages are delivered.
- •Free cash flow (after $1,441M capex) of roughly $2.45B funded $1,247M of debt repayment, $414M of reinstated dividends and $381M of share repurchases.
- •Capex ($1,441M) roughly matches D&A ($1,419M), indicating near-maintenance-level spend plus modest fleet growth.
🏰 Competitive Position
The world's largest cruise operator enjoys scale, multiple brands, owned port destinations and a $9B customer float, but operates a capital-intensive, cyclical, price-competitive industry with low switching costs.
- +Scale leader with a portfolio of brands plus owned exclusive islands and port destinations.
- +$9.0B in customer deposits acts as interest-free float and provides strong forward-booking visibility.
- +Deleveraging momentum — total debt cut $1.8B to $25.6B since November 2025, with interest expense falling.
- +Resumed capital returns (dividend and buyback) signal a recovering balance sheet; completed DLC unification simplifies the structure into a single NYSE listing.
- -Still highly leveraged — $25.6B debt against $13.0B equity, with debt-to-capital near the 65% covenant limit.
- -Margin compression — operating income fell YoY despite record revenue as fuel (+27%) and payroll (+9%) outran a 5% Q2 revenue gain.
- -Capital-intensive with large multi-year newbuild commitments ($0.5B remainder-2026 plus $1.6B/$1.5B/$1.8B/$1.7B for 2027–2030 and $11.4B thereafter).
- -Cyclical demand highly sensitive to macro, geopolitical and health shocks.
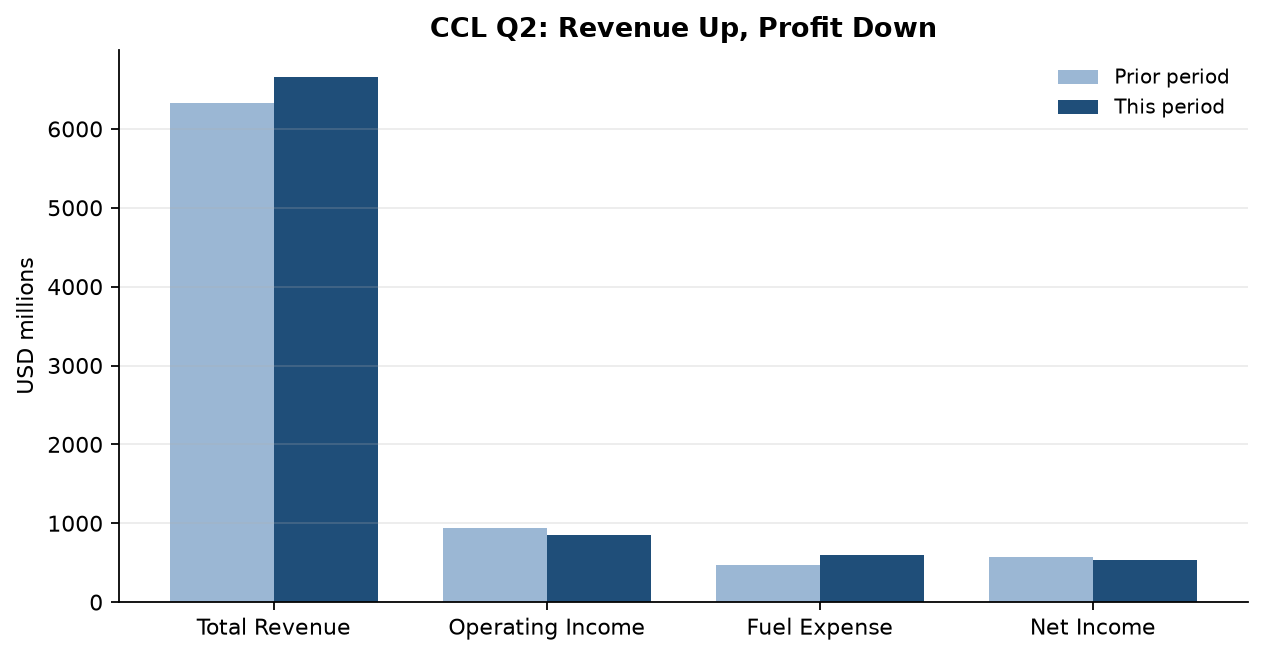
The tape reads like a victory lap: Carnival posted record Q2 revenue of $6.66B, six-month net income nearly doubled to $795M, customer deposits hit an all-time $9.0B, and management reinstated both a dividend and a buyback. The cruise recovery, the story goes, is finished.
Look one line up from the bottom. Q2 operating income actually fell to $851M from $934M, and six-month operating income slipped to $1,458M from $1,477M — both despite higher revenue. The profit surge came entirely from below the operating line: interest expense dropped $141M for the half as Carnival paid down debt, and last year's $255M debt-extinguishment charge didn't recur. Meanwhile fuel jumped 27% and payroll 9% in Q2, outrunning a 5% revenue gain. In plain English, the balance-sheet repair is doing the heavy lifting, not the cruise business — and per-share comparisons are further blurred by roughly 5% more shares from convertible-note conversions.
Two quieter items reward attention. Carnival extended ship depreciable lives to 35 years and cut residual values effective December 2025 — a prospective estimate change it labels immaterial, yet one that structurally lowers future depreciation and supports reported margins. And the $3.9B operating cash flow is flattered by a $1.66B seasonal build in customer deposits: genuine forward demand, but a working-capital tailwind that unwinds as those voyages sail.
What to watch: whether net cruise costs and fuel can be contained enough for operating income to grow on its own. The deleveraging tailwind is finite — debt-to-capital still sits near the 65% covenant ceiling — so at some point the operating engine, not the interest line, has to carry earnings.
Want this on every stock you own?
Run instant AI analysis of any 10-K or 10-Q from EDGAR — major risks, red flags, cash flow quality, and moat — with Value of Stock Premium.
This analysis is generated from the filing text and is for educational purposes only — not financial advice. Always do your own research before investing.