Concentrix ($CNXC) Q2: EPS Jumps to $0.86 While Operating Income Craters 36% — the 'Beat' Lives Entirely Below the Line
The jump in quarterly EPS from $0.63 to $0.86 is manufactured below the operating line: operating income fell 36% while a $63.3M swing in non-operating 'other income' and a smaller share count (60.9M vs 63.4M basic) did all the lifting. The core services business is being squeezed, not recovering.
CNXC
10-QCautiousConcentrix Corporation
The jump in quarterly EPS from $0.63 to $0.86 is manufactured below the operating line: operating income fell 36% while a $63.3M swing in non-operating 'other income' and a smaller share count (60.9M vs 63.4M basic) did all the lifting. The core services business is being squeezed, not recovering.
⚠ Major Risks
- •Margin compression is accelerating: Q2 cost of revenue rose $69.9M on only $45.1M of revenue growth, cutting gross profit by $24.8M year-over-year and driving operating income down 36% to $95.4M from $148.3M.
- •A refinancing wall just went current: $650M of debt now sits in current liabilities — $450M of term loans plus $200M of 6.650% Senior Notes due August 2026 — against only $255.6M of cash and equivalents.
- •The debt stack is expensive and staying that way: all four senior note series carry 6.50%–6.85% coupons, and the February 2026 refinancing replaced 6.650% paper with 6.500% paper, locking in elevated interest costs ($143.4M net interest expense in six months).
- •Working capital is draining cash: a $251.4M outflow from other operating assets and liabilities — including a $106.9M drop in accrued compensation and benefits since November — cut six-month operating cash flow 27% to $174.7M.
- •Structural FX exposure to the Philippine peso and Indian rupee: the designated FX-forward book swung to a $53.9M liability position (from $21.4M), and $28.1M of existing hedge losses in AOCL are expected to hit earnings within twelve months.
🔍 Accounting Red Flags
- ▲Earnings quality: the entire Q2 net-income improvement came from below the operating line — 'Other expense (income), net' swung from a $21.2M expense to $42.1M of income (a $63.3M pre-tax swing) while operating income fell $52.9M.
- ▲Off-balance-sheet receivables financing: $627M of accounts receivable were factored in six months under non-recourse 'true sale' programs, with $95M sold and removed from the balance sheet at quarter-end — flattering both receivables and operating cash flow.
- ▲Retained earnings flipped from a $1.26B surplus at May 31, 2025 to a $146.5M deficit, and goodwill is roughly $1.48B lower than a year ago ($3.65B vs $5.13B) — the residue of major charges taken in late FY2025 that this filing does not re-explain; goodwill plus intangibles ($5.40B) still equal twice total equity ($2.70B).
- ▲Allowance for credit losses rose 30% in six months ($17.4M to $22.6M), with net additions up year-over-year ($6.1M vs $4.9M).
- ▲The 'non-core' divestiture carries $202.7M of held-for-sale assets (largely client funds and intangibles) against a sale price of only about €15M, and has already produced a $6.9M loss plus an $8.8M goodwill write-out.
💰 Cash Flow Quality
Six-month operating cash flow fell 27% to $174.7M, consumed by a $251.4M working-capital outflow, and barely covered capex plus dividends and buybacks.
- •Net cash from operations was $174.7M versus $237.9M a year earlier, despite $319.5M of combined depreciation and amortization add-backs on just $76.9M of net income.
- •Accrued compensation and benefits fell $106.9M and other accrued liabilities fell $181.3M since November — the company is paying down obligations faster than it is generating cash.
- •Capex of $102.1M plus $46.2M of dividends and $43.2M of buybacks left cash and equivalents down $71.8M, at $255.6M.
- •Collections are propped up by $627M of non-recourse receivables factoring, which pulls cash forward and moves credit risk off the books.
- •The Securitization Facility balance rose to $612.5M from $537.0M — short-term secured borrowing is quietly filling the gap.
🏰 Competitive Position
Scale and client diversification are real, but the income statement shows a labor-arbitrage business losing pricing power faster than it can cut costs.
- +More than 2,000 clients across five industry verticals, with no single client above 10% of revenue or receivables.
- +A global delivery footprint (Philippines, India, US, France) that smaller rivals cannot easily replicate.
- +Revenue is still growing — up $173.3M for the six months — indicating clients are staying even as margins compress.
- -Q2 cost of revenue grew more than twice as fast as revenue, signaling wage inflation or price concessions the company cannot pass through.
- -Delivery concentration in the Philippines and India creates permanent FX exposure that must be hedged at billion-dollar notional scale.
- -Roughly $4.6B of total debt at 6.50%–6.85% coupons absorbs cash that competitors with cleaner balance sheets can spend on technology.
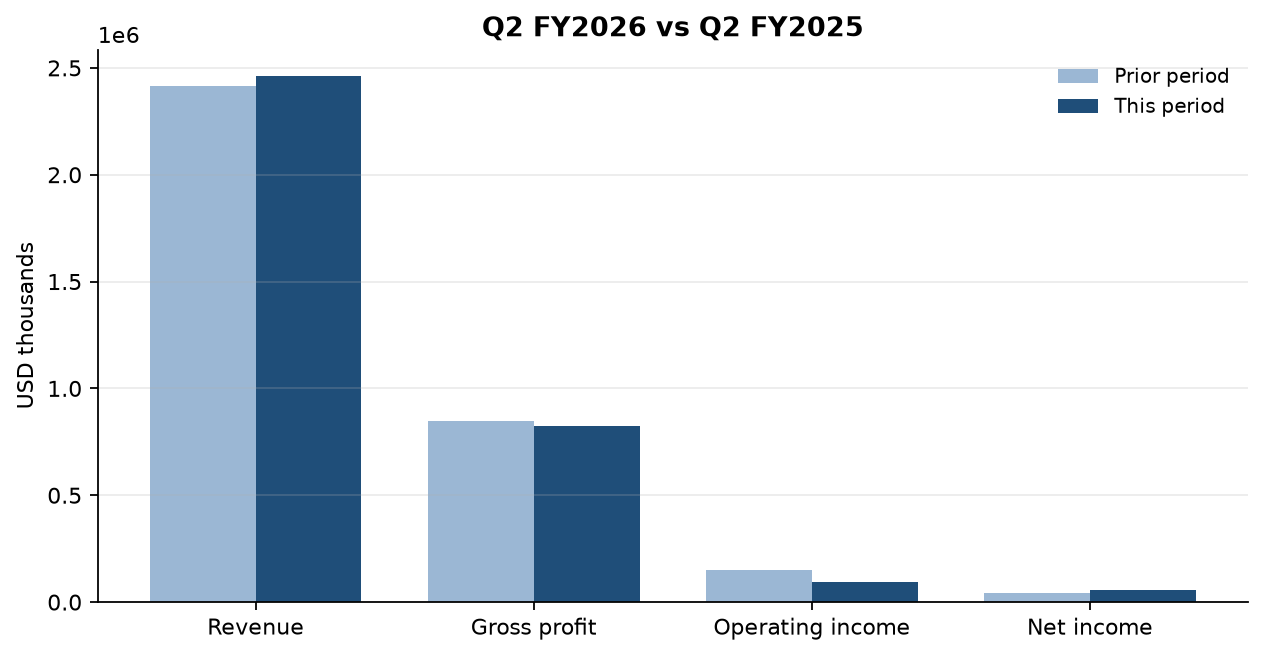
The surface read on this quarter is a comeback story: revenue up to $2.46 billion, net income up 31% to $55.3 million, EPS up from $0.63 to $0.86. The actual filing tells the opposite story. Operating income — the number that measures whether the business itself works — fell from $148.3 million to $95.4 million, a 36% decline. Gross profit dropped $24.8 million even though revenue rose $45.1 million, because the cost of delivering services grew more than twice as fast as the revenue those services brought in. That is what pricing pressure looks like in a people-heavy outsourcing business.
So where did the earnings 'growth' come from? Two places, neither of them the business. 'Other expense (income), net' swung from a $21.2 million expense a year ago to $42.1 million of income this quarter — a $63.3 million pre-tax swing that is larger than the entire year-over-year improvement in net income. And the share count shrank from 63.4 million to 60.9 million thanks to buybacks, spreading the profit over fewer shares. Strip those out and this was a materially worse quarter than last year's, dressed up as a better one.
The cash flow statement corroborates the squeeze. Operating cash flow fell 27% to $174.7 million for the half, dragged down by a $251.4 million working-capital outflow — notably a $106.9 million decline in accrued compensation since November. Cash on hand fell to $255.6 million while $650 million of debt moved into current liabilities, including $200 million of 6.650% notes due this August and $450 million of term loans. The company just refinanced $600 million of 2026 notes at 6.50% — so the debt isn't getting cheaper, and the securitization facility balance rose to $612.5 million to help bridge the gap. Meanwhile, $627 million of receivables were factored off the balance sheet in six months, which flatters both collections and reported cash flow.
The one thing to watch: gross margin. Revenue growth means clients aren't leaving — but if cost of revenue keeps outrunning the top line, the below-the-line accounting that saved this quarter cannot save the next one. Watch too how the August maturity and the $450 million of current term loans get funded with only $256 million of cash in the till.
Want this on every stock you own?
Run instant AI analysis of any 10-K or 10-Q from EDGAR — major risks, red flags, cash flow quality, and moat — with Value of Stock Premium.
This analysis is generated from the filing text and is for educational purposes only — not financial advice. Always do your own research before investing.