National Beverage ($FIZZ): a 5.2% Price Hike Masks a 6.7% Volume Slide — the LaCroix Engine Is Stalling While the Stock Is the Only Loser in Its Own 5-Year Peer Chart
Reported revenue looks merely soft (-1.7%), but it hides a 6.7% case-volume decline offset by a 5.2% price increase — a premium, discretionary brand shedding that much volume while pushing price is a demand-elasticity warning, not evidence of pricing power. The tell to watch is whether volume stabilizes at the new price points.
FIZZ
10-KCautiousNational Beverage Corp.
Reported revenue looks merely soft (-1.7%), but it hides a 6.7% case-volume decline offset by a 5.2% price increase — a premium, discretionary brand shedding that much volume while pushing price is a demand-elasticity warning, not evidence of pricing power. The tell to watch is whether volume stabilizes at the new price points.
⚠ Major Risks
- •Volume erosion / demand elasticity: case volume fell 6.7% across both Power+ and carbonated soft drink brands, offset only by a 5.2% price increase — a sign consumers may be reaching the limit of what they will absorb on a discretionary 'better-for-you' brand.
- •Retail customer consolidation: management flags a shrinking, more concentrated customer base with greater purchasing power that limits FIZZ's ability to raise prices with certain accounts, even as e-commerce and value stores grow.
- •Commodity and tariff cost inflation: dependence on aluminum, resin, corn, linerboard, CO2 and juice concentrate exposes the P&L to price volatility and tariffs, with limited ability to pass increases through without losing volume.
- •Intense competition from far larger rivals: The Coca-Cola Company, PepsiCo, Keurig Dr Pepper and Nestlé have greater financial, marketing and distribution resources and can discount to defend share.
- •Regulatory/policy risk: proposals to phase out synthetic dyes and to remove sweetened products from SNAP, plus potential soft-drink/sweetened-beverage taxes, could raise costs or cut demand for certain products.
🔍 Accounting Red Flags
- ▲Related-party management fee: $11.8 million paid in Fiscal 2026 to Corporate Management Advisors (CMA), a chairman-controlled entity, calculated as a percentage of consolidated net sales — a recurring value transfer to the controlling shareholder ($3.0 million still payable at year-end).
- ▲Inventory build into falling demand: inventories rose $10.4 million and annual inventory turns fell from 8.7x to 8.2x even as case volume dropped 6.7%, meaning finished goods accumulated against a shrinking order book.
- ▲Sales incentives are recorded as a reduction of net sales using management judgment on volume and performance estimates — standard, but a lever over the reported top line worth monitoring given the volume decline.
💰 Cash Flow Quality
Debt-free and cash-rich with clean earnings-to-cash conversion, though operating cash flow slipped on a working-capital build and the cash is periodically swept out via special dividends rather than reinvested.
- •Operating cash flow of $181.3 million nearly matches net income of $183.6 million — high earnings quality — but fell from $206.7 million on a working-capital (inventory) increase.
- •Capital expenditures of only $25.1 million (down from $36.3 million) imply roughly $156 million of free cash flow.
- •$349.5 million in cash, zero debt outstanding, a $150 million undrawn revolver, and a current ratio of 4.4:1.
- •The $155.7 million Fiscal 2026 cash build is effectively earmarked for the $3.25/share special dividend declared July 1, 2026, mirroring the $304.1 million special dividend paid in Fiscal 2025; buybacks were a token 20,000 shares ($0.7 million).
🏰 Competitive Position
LaCroix is the #1 premium domestic sparkling water with genuine brand equity and a vertically integrated low-cost network, but it is dwarfed by its rivals and is currently losing volume.
- +LaCroix category leadership and brand trust (named a Newsweek 'Most Trusted Brand' four consecutive years).
- +Vertical integration across twelve U.S. production facilities gives cost control, quality control and rapid speed-to-market versus third-party-bottler competitors.
- +Pristine balance sheet: no debt, $349.5 million cash, strong free cash flow.
- +Asset-light, in-house innovation model with low-cost social/regional marketing instead of national advertising.
- -Competes against Coca-Cola, PepsiCo, Keurig Dr Pepper and Nestlé, all with far greater resources.
- -Heavy concentration in LaCroix, its 'most significant brand'.
- -Retail customer consolidation erodes pricing power; case volume is declining.
- -Negligible international footprint (primarily U.S.).
- -Controlled-company governance overhang (CMA related-party fee, episodic special-dividend cadence, minimal buybacks).
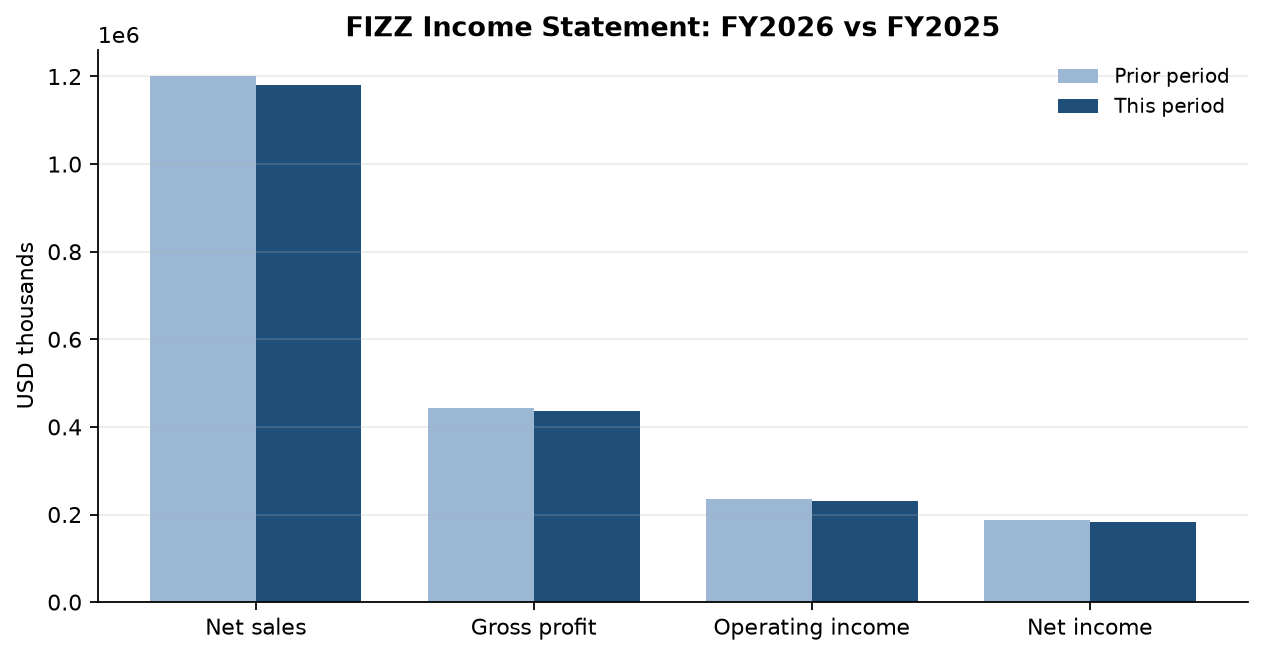
The bull case on National Beverage is almost aesthetic: no debt, $349.5M of cash, a 37% gross margin held flat year over year, and LaCroix sitting atop the premium sparkling-water category. On that surface, a 1.7% dip in net sales to $1,180.6M and net income of $183.6M reads like a rounding error in an otherwise pristine compounder.
Strip the price effect and the picture changes. Management held the line by pushing average selling price per case up 5.2% while case volume fell 6.7% across both Power+ and carbonated brands — and the 'one less selling week' explains only a sliver of that gap. A premium, discretionary, 'better-for-you' brand does not usually shed nearly 7% of its units while raising price unless it is trading volume for price to defend the P&L. Flat gross margin here isn't operating leverage; it's price barely offsetting packaging and ingredient inflation. That is elasticity, not pricing power.
Meanwhile the cash pile isn't compounding for shareholders so much as being periodically swept out: the $155.7M Fiscal 2026 cash build is essentially earmarked for the $3.25/share special dividend declared July 1, mirroring the ~$304M paid in Fiscal 2025, while buybacks were a token 20,000 shares. Add the $11.8M related-party management fee to chairman-controlled CMA, and this looks like a controlled company run for episodic cash extraction rather than per-share growth. The market has noticed: FIZZ's five-year total return sits at 80 against 100 invested in 2021 — the only line in its own performance chart that lost money, while the soft-drinks index gained 45%.
Watch volume, not revenue. If the next year shows case volume stabilizing at the new price points, the pricing was durable; if volume keeps sliding, the 2026 top line was borrowed from 2027, and margin will eventually follow the units down.
Want this on every stock you own?
Run instant AI analysis of any 10-K or 10-Q from EDGAR — major risks, red flags, cash flow quality, and moat — with Value of Stock Premium.
This analysis is generated from the filing text and is for educational purposes only — not financial advice. Always do your own research before investing.