H.B. Fuller ($FUL): Q2 Net Income Leaps 62% to $67.8M — But Most of the Jump Is Last Year's One-Time Tax Charge Rolling Off, Not the Core Business
The eye-catching 62% earnings surge is largely an optical artifact of last year's one-time discrete tax charge wearing off; the real, more modest story is genuine gross-margin expansion paired with a goodwill-heavy balance sheet that is about to take on more bridge-financed leverage to buy Advanced Medical Solutions.
FUL
10-QCautiousH.B. Fuller Company
The eye-catching 62% earnings surge is largely an optical artifact of last year's one-time discrete tax charge wearing off; the real, more modest story is genuine gross-margin expansion paired with a goodwill-heavy balance sheet that is about to take on more bridge-financed leverage to buy Advanced Medical Solutions.
⚠ Major Risks
- •Heavy, rising leverage: $2.07B of long-term debt, including $300M of 4.0% public notes due Feb 15, 2027 that are classified as long-term only on the intent and ability to refinance via the revolver — refinancing risk if credit conditions tighten.
- •Goodwill ($1.69B) plus other intangibles ($767M) together exceed total equity ($2.08B); the acquisition-built balance sheet carries impairment risk (a $734 trade-name impairment was already booked in FY25).
- •Subsequent-event acquisition of UK-listed Advanced Medical Solutions Group plc, which the filing indicates is being funded through new secured and unsecured bridge credit agreements — integration risk plus additional leverage on top of existing debt.
- •Large foreign-currency exposure: FX translation swung other comprehensive income by over $100M in the prior-year period, and the company carries a $119.3M net-investment-hedge liability and a $21.0M fair-value-hedge liability.
- •Ongoing restructuring (2023 Plans of $85-90M nearing completion, plus a new global footprint optimization of $11.2-13M through FY28) and legacy litigation/environmental claims (asbestos, product/environmental claims tied to a divested business).
🔍 Accounting Red Flags
- ▲The 62% YoY net-income jump is heavily flattered by the prior-year quarter's $13,961 of discrete withholding-tax expense; ex-discrete, the underlying effective tax rate actually ROSE to 27.4% from 25.7%, so the headline overstates operating improvement.
- ▲Six-month operating cash flow more than doubled to $117.2M, but roughly $80.5M came from stretching accounts payable while receivables (-$53.9M) and inventory (-$51.3M) consumed cash — earnings quality leans on working-capital timing.
- ▲Tangible book value is effectively negative: goodwill + intangibles ($2.46B) exceed total equity ($2.08B).
- ▲$300M of notes maturing in ~8 months are held in long-term debt purely on the basis of intent/ability to refinance, not committed long-term financing.
💰 Cash Flow Quality
Operating cash flow more than doubled, but the gain leans on a large accounts-payable stretch while capex surged, leaving free cash flow thin relative to shareholder payouts.
- •Six-month operating cash flow of $117.2M vs $57.8M a year ago.
- •Accounts payable contributed +$80.5M of operating cash; receivables (-$53.9M) and inventory (-$51.3M) together absorbed over $100M.
- •Capex rose ~60% to $104.4M from $64.5M, leaving free cash flow of only about $13M for the half.
- •Dividends ($26.0M) and buybacks ($48.8M) totaled $74.8M — well above free cash flow, with net borrowing helping bridge the gap.
🏰 Competitive Position
A global specialty-adhesives leader with diversified end markets and a deliberate mix shift toward higher-margin medical adhesives, but growth is acquisition-dependent and the product base carries commodity/raw-material exposure.
- +Global scale across three segments (Hygiene, Health & Consumable Adhesives; Engineering Adhesives; Building Adhesive Solutions).
- +Mix shift into higher-margin specialty and medical adhesives (GEM/Medifill, ND Industries, pending AMS).
- +Gross margin expanded to ~33.6% from ~31.9% year over year.
- -Top-line growth is modest organically (six-month revenue +2%) and increasingly reliant on bolt-on acquisitions.
- -Raw-material/commodity cost exposure embedded in cost of sales.
- -High debt load, sizable FX exposure, and a goodwill-heavy balance sheet leave little margin of safety.
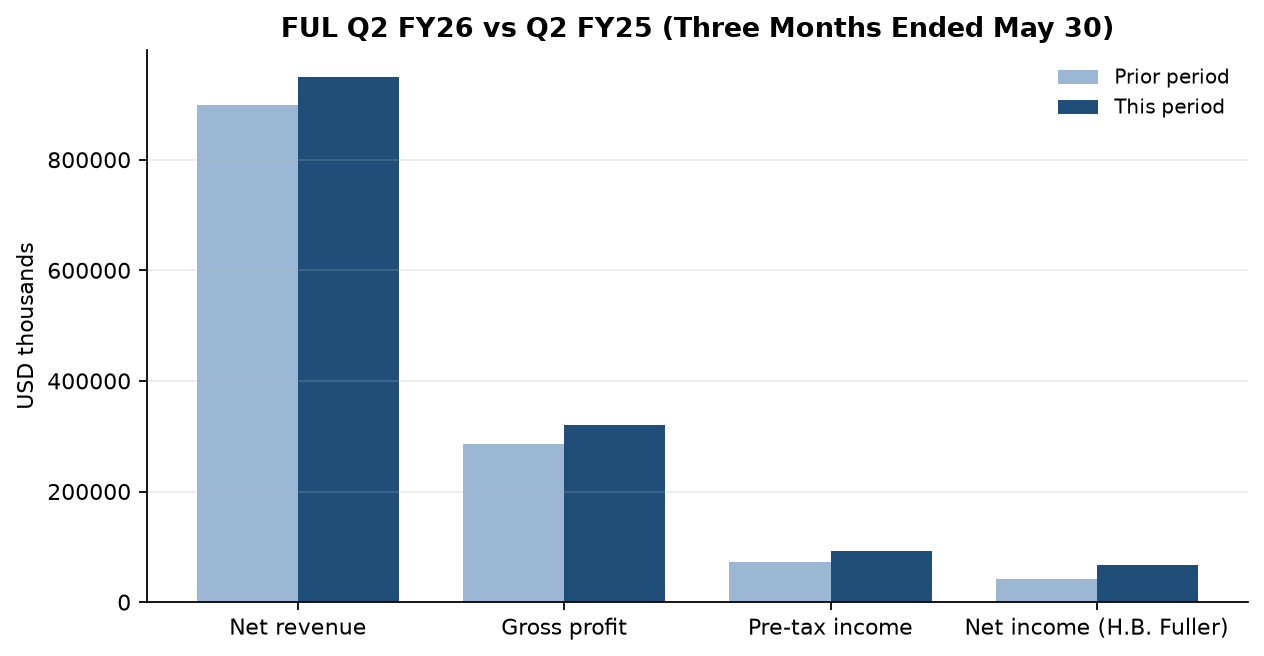
On the tape it reads like a blowout: H.B. Fuller's Q2 net income jumped 62% to $67.8M and diluted EPS went from $0.76 to $1.23, on revenue up ~6% to $950.3M and gross margin widening to roughly 33.6% from 31.9%. The easy read is that a sleepy adhesives maker just inflected.
But the size of the earnings jump is mostly a tax illusion. The year-ago June quarter carried $13,961 of discrete tax expense — withholding tax on earnings no longer permanently reinvested — that crushed reported profit; this year's quarter had almost none. Strip that out and the underlying effective tax rate actually rose to 27.4% from 25.7%. The genuine progress is at the gross-margin and operating line — operating income (gross profit less SG&A) grew roughly 17% — not the 62% the bottom line advertises.
Cash quality is softer than the income statement, too. Six-month operating cash flow more than doubled to $117.2M, but about $80.5M of that came from stretching accounts payable while receivables and inventory together soaked up over $100M. With capex up ~60% to $104.4M, free cash flow was only about $13M — yet the company still paid $26.0M in dividends and repurchased $48.8M of stock. Meanwhile goodwill and intangibles ($2.46B) now exceed total equity ($2.08B): tangible book is negative, the residue of a roll-up strategy.
The one thing to watch: the subsequent-event acquisition of UK-listed Advanced Medical Solutions Group plc, which the filing indicates is being funded through new secured and unsecured bridge credit agreements. Layered on $2.07B of existing long-term debt — including $300M of 4.0% notes due February 2027 that sit in long-term debt only on the intent to refinance — it pushes FUL further into a leverage-and-acquire model. The medical-adhesives mix shift is strategically sound; the question is how thin the balance-sheet margin of safety gets paying for it.
Want this on every stock you own?
Run instant AI analysis of any 10-K or 10-Q from EDGAR — major risks, red flags, cash flow quality, and moat — with Value of Stock Premium.
This analysis is generated from the filing text and is for educational purposes only — not financial advice. Always do your own research before investing.