Greenbrier ($GBX): Behind a 32% Revenue Drop, Nearly a Third of Operating Profit Now Comes From Selling Off Its Own Lease Fleet
The reported profit is being cushioned by non-core equipment-sale gains and a debt-financed lease-fleet build, masking how weak the core manufacturing cycle has become; the real test is whether the $426.7M syndication inventory converts back to cash at a gain.
GBX
10-QCautiousThe Greenbrier Companies, Inc.
The reported profit is being cushioned by non-core equipment-sale gains and a debt-financed lease-fleet build, masking how weak the core manufacturing cycle has become; the real test is whether the $426.7M syndication inventory converts back to cash at a gain.
⚠ Major Risks
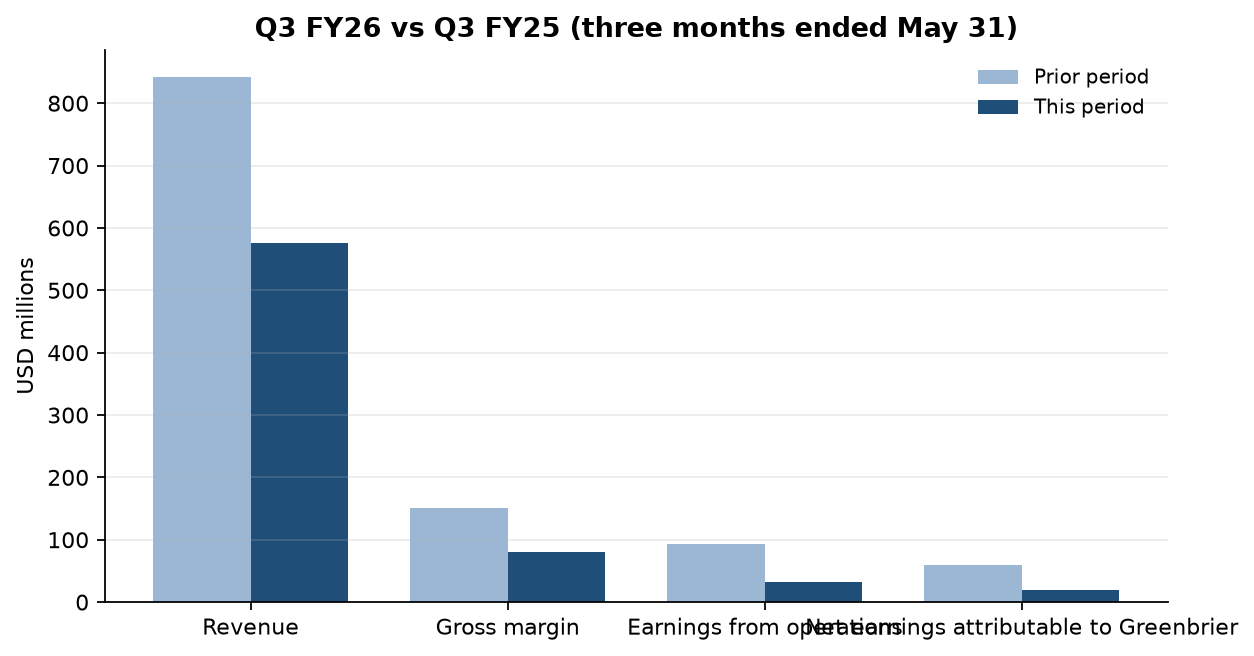
- •Deep manufacturing cyclicality: Q3 railcar sales fell to $431.7M from $694.3M and total revenue to $576.5M from $842.7M (-32% YoY), cutting net earnings to Greenbrier to $18.9M from $60.1M.
- •Margin compression: Q3 gross margin fell to ~14% ($81.1M on $576.5M) from ~18% ($151.5M on $842.7M), signaling pricing/mix/cost pressure as volumes drop.
- •Leverage and rising financing cost: total debt of $1,805.6M with new fixed-rate GBXL notes at 5.13%–5.30% and floating SOFR/EURIBOR/WIBOR facilities; Q3 interest and FX expense rose to $16.5M from $13.2M.
- •Astra put option: the ~25% noncontrolling holder of Greenbrier-Astra Rail B.V. can put its stake to the Company at a purchase price that is still undetermined and was extended during Q3 — an unquantified potential cash obligation.
- •Near-term foreign facility maturities: Mexican lines mature July 2026–March 2027 and certain European lines from September 2026, requiring renewal amid tighter conditions.
🔍 Accounting Red Flags
- ▲Earnings quality: nine-month operating earnings of $118.1M include $36.7M of net gains on equipment disposition (up from $16.8M) — ~31% of operating income came from selling assets rather than core operations.
- ▲Cash conversion: nine-month operating cash flow of $8.1M is far below net earnings of $68.7M and down from $167.7M a year ago, driven by a $189.9M build in leased railcars for syndication.
- ▲A $(1.2)M net warranty credit to Q3 cost of revenue (accrued warranty fell to $15.5M from $22.3M YoY) modestly flattered gross margin.
- ▲Segment measurement basis changed effective Sept 1, 2025 with prior periods recast, reducing period-over-period comparability of the Manufacturing vs Leasing split.
💰 Cash Flow Quality
Operating cash flow collapsed to $8.1M for the nine months as capital was redirected into a syndication-fleet build, with dividends, buybacks and a JV distribution funded largely by asset sales and new debt.
- •Net cash from operations of $8.1M vs $167.7M a year earlier and vs $68.7M of net earnings.
- •Primary drag: $189.9M invested in leased railcars for syndication (balance nearly doubled to $426.7M from $225.9M), plus a $70.5M reduction in payables.
- •Financing leaned on $620.2M of >90-day debt proceeds, including $300M of GBXL I asset-backed notes; $170.3M of asset-sale proceeds helped fund $32.0M dividends, $13.3M buybacks and a $38.8M JV partner distribution.
- •Cash and equivalents eased to $273.7M while restricted cash rose to $49.1M.
🏰 Competitive Position
An integrated railcar manufacturer-lessor with scale and a captive funding platform, but in a cyclical, capital-intensive market with limited pricing power.
- +Integrated model spanning manufacturing, leasing/syndication and maintenance, with a $1,298.4M owned operating-lease fleet and Leasing & Fleet revenue that held flat at $142.5M.
- +Contracted visibility: $1,010.1M of railcar-sales performance obligations plus $143.9M of fleet-management obligations.
- +Access to non-recourse structured funding via the GBXL securitization platform to finance the lease fleet at fixed rates.
- -Severe cyclicality: manufacturing revenue -33% YoY with margins compressing to ~14%.
- -High capital intensity and $1.8B of debt make earnings sensitive to funding costs.
- -Commoditized new-railcar market limits pricing power; results swing with rail-industry capex cycles.
On the surface this looks like a clean cyclical wipeout: Greenbrier's Q3 revenue fell 32% to $576.5M and net earnings to shareholders dropped to $18.9M ($0.60 diluted) from $60.1M ($1.86), as new-railcar sales collapsed from $694.3M to $431.7M. The easy read is 'railcar down-cycle, nothing to see.'
But look at how the profit was actually made. Of the $118.1M in nine-month operating earnings, $36.7M — nearly a third — came from gains on selling equipment out of the lease fleet, more than double last year's $16.8M. Strip that out and the core is weaker than the ~14% gross margin (down from ~18%) already implies. Meanwhile operating cash flow essentially vanished — $8.1M for nine months versus $167.7M a year ago — because management poured $189.9M into 'leased railcars for syndication,' nearly doubling that line to $426.7M, and plugged the gap with $620M of new borrowings, including $300M of GBXL asset-backed notes.
In plain English: as customers stopped buying new railcars, Greenbrier redirected capital into building and leasing cars itself, then booked gains selling seasoned equipment — converting a manufacturing air-pocket into leasing and asset-sale income. Leasing & Fleet revenue barely moved ($142.5M vs $143.5M), the ballast that model is designed to provide. It's a defensible pivot, not a distress signal — but current earnings quality is lower than the P&L suggests and the growth is being carried on the balance sheet.
Two things to watch: whether that $426.7M of syndication inventory actually converts back to cash at a gain in coming quarters, and the Astra put option on the ~25% stake in Greenbrier-Astra Rail — now extended, with a purchase price still undetermined — which could force an unquantified cash buyout.
Want this on every stock you own?
Run instant AI analysis of any 10-K or 10-Q from EDGAR — major risks, red flags, cash flow quality, and moat — with Value of Stock Premium.
This analysis is generated from the filing text and is for educational purposes only — not financial advice. Always do your own research before investing.