CarMax ($KMX): Revenue Rose 6% but Gross Profit and Earnings Fell as Used-Car Margins Compressed, the Buyback Quietly Stopped, and Subprime Loan Exposure Jumped ~29%
CarMax's top line grew, but the growth was bought rather than earned: used-vehicle gross profit dollars fell as per-unit margins compressed, net earnings dropped nearly 12%, and the company leaned into subprime auto loans while quietly halting its buyback — a lower-quality quarter beneath a superficially solid revenue headline.
KMX
10-QCautiousCarMax, Inc.
CarMax's top line grew, but the growth was bought rather than earned: used-vehicle gross profit dollars fell as per-unit margins compressed, net earnings dropped nearly 12%, and the company leaned into subprime auto loans while quietly halting its buyback — a lower-quality quarter beneath a superficially solid revenue headline.
⚠ Major Risks
- •Used-vehicle margin compression: used-vehicle gross profit fell to ~$501.4M from ~$554.2M even as used sales rose 4.7%, so used gross margin slipped from ~9.1% to ~7.8% — a volume-over-margin trade that signals limited pricing power.
- •Subprime credit expansion: Tier 2/Tier 3 receivables grew to $707.6M from $550.4M (~29%), the loan-loss allowance rose to 2.95% of loans ($475.0M) from 2.78%, and total past-due loans edged up to 5.20%.
- •Rising funding costs and securitization dependence: interest expense rose ~25% to $33.8M, CAF interest margin narrowed to $276.7M from $287.9M, and the company carries $16.08B of non-recourse notes reliant on warehouse and term-securitization markets.
- •Earnings deterioration: net earnings fell 11.8% to $185.6M and pretax earnings fell to $258.6M despite higher revenue; EPS held up better (-5% to $1.31) only because the share count is ~7% lower year over year.
- •Macro sensitivity: loss reserves hinge on a single macro scenario tied to U.S. unemployment and the Black Book used-vehicle index, so a downturn would pressure both vehicle demand and CAF credit losses simultaneously.
🔍 Accounting Red Flags
- ▲Net earnings of $185.6M versus operating cash flow of just $17.6M (down from $299.5M) — a wide divergence driven by a $518.5M build in auto loans held for sale; a funding-timing item, but it leaves reported operating cash flow very thin this quarter.
- ▲The loan-loss allowance is a judgment-heavy estimate built on a single macroeconomic scenario with a two-year reasonable-and-supportable window reverting to history over 12 months, while the book is actively shifting toward lower-credit Tier 2/3 loans.
- ▲The Level 3 residual-certificate fair value relies on an unobservable ~18% discount rate (immaterial at $4.1M, but a fully subjective input).
💰 Cash Flow Quality
Reported operating cash flow collapsed to $17.6M from $299.5M, though the drop is dominated by a $518.5M build in loans held for sale that should reverse as those loans are securitized.
- •Operating cash flow of $17.6M covered less than 10% of net earnings ($185.6M); the gap is almost entirely the auto-loans-held-for-sale buildup (from $100.5M to $619.0M on the balance sheet).
- •Management conserved cash: open-market buybacks effectively halted ($2.3M vs $204.0M a year ago) and capital expenditures were cut to $103.3M from $136.7M.
- •Non-cash provisions remain large — $95.6M net provision for loan losses and $26.2M for cancellation reserves — reflecting the credit-intensive captive-finance model.
- •Heavy reliance on securitization funding: $3.26B of non-recourse notes issued against $3.01B repaid during the quarter.
🏰 Competitive Position
As the nation's largest used-vehicle retailer with scale, a no-haggle brand, an omnichannel platform and a captive-finance flywheel, CarMax has a real but eroding edge in a fragmented, low-switching-cost market.
- +Largest U.S. used-vehicle retailer with national footprint and scale advantages in sourcing and reconditioning.
- +Captive CarMax Auto Finance arm captures additional spread and steady income (~$140M this quarter) and deepens the customer relationship.
- +Recognized no-haggle brand and omnichannel (online/in-store) buying experience in a market where most competitors are sub-scale.
- -This quarter's margin compression shows limited pricing power — the company had to thin used-vehicle spreads to move volume.
- -Highly fragmented, cyclical market with low switching costs and intense competition from franchised dealers and online rivals.
- -Profitability is increasingly leveraged to consumer credit, with growth tilting toward riskier Tier 2/3 borrowers.
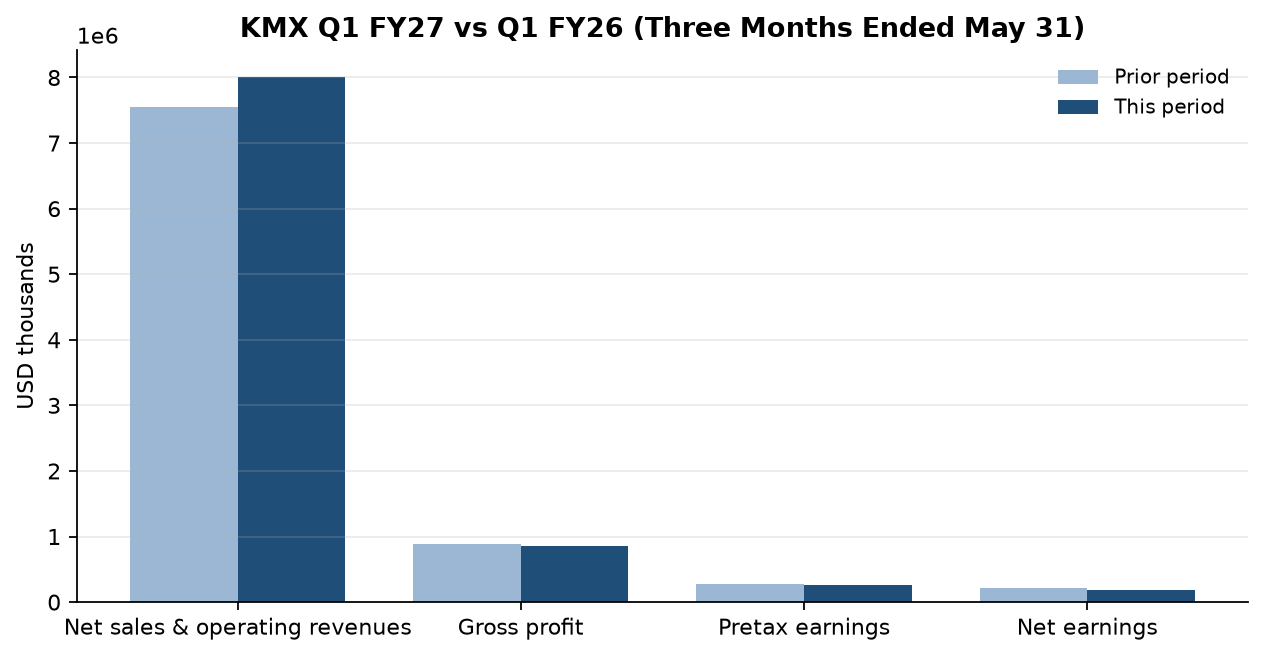
The consensus read on this quarter is upbeat: net sales rose 6.2% to $8.01B, used-vehicle revenue climbed 4.7%, and EPS of $1.31 looks like only a modest 5% slip — evidence that retail demand is recovering. Invert it, and the numbers tell a harder story. Gross profit actually fell to $854.4M from $893.6M, because used-vehicle gross margin compressed from roughly 9.1% to 7.8% — used-vehicle gross profit dollars dropped about $53M even as the company sold more cars. CarMax moved metal at thinner spreads; this was volume bought with margin, not pricing power.
The second engine, CarMax Auto Finance, shows the same reach for growth. Tier 2/Tier 3 (lower-credit) receivables jumped ~29% to $707.6M, the loan-loss allowance rose to 2.95% of loans from 2.78%, and total past-due loans ticked up to 5.20%, even as CAF's interest margin narrowed and interest expense rose ~25%. So the profit cushion is being stretched at exactly the moment the credit book is moving down the quality spectrum.
Management's own actions confirm the caution. Open-market buybacks went from over $200M a year ago to essentially zero, and capex was trimmed — cash conservation that coincides with reported operating cash flow collapsing to $17.6M from $299.5M. Most of that collapse is a $518M build in loans held for sale that should reverse on securitization, so it isn't a solvency alarm, but the combination of a halted buyback and cut capex is a tell.
The one thing to watch: whether used-vehicle gross profit per unit stabilizes next quarter, and whether the fast-growing Tier 2/3 loan book holds up as it seasons. If margins keep thinning while subprime losses build, the revenue growth that headlines applaud will keep failing to reach the bottom line.
Want this on every stock you own?
Run instant AI analysis of any 10-K or 10-Q from EDGAR — major risks, red flags, cash flow quality, and moat — with Value of Stock Premium.
This analysis is generated from the filing text and is for educational purposes only — not financial advice. Always do your own research before investing.