MSC Industrial ($MSM): Q3 EPS Leapt 41% to $1.44 — But Nine-Month Operating Cash Flow FELL 11% as Inventory Builds and Short-Term Debt Swells to $417M
The 41% Q3 EPS surge overstates the underlying trend: nine-month operating cash flow actually fell as an inventory build and a payables reversal absorbed the earnings gain, while a one-time ERC credit and an expanded receivables-sale program helped optics — with a top-heavy short-term debt stack now the key thing to monitor.
MSM
10-QCautiousMSC Industrial Direct Co., Inc.
The 41% Q3 EPS surge overstates the underlying trend: nine-month operating cash flow actually fell as an inventory build and a payables reversal absorbed the earnings gain, while a one-time ERC credit and an expanded receivables-sale program helped optics — with a top-heavy short-term debt stack now the key thing to monitor.
⚠ Major Risks
- •Front-loaded refinancing risk: $417.2M of current debt against just $74.1M cash, including $217M of Uncommitted Credit Facilities that lenders are 'not obligated' to roll over and a $100M 2.90% note maturing July 28, 2026 — weeks after quarter-end.
- •Cyclical demand concentration: 58% of revenue comes from Manufacturing Heavy customers, leaving results highly geared to industrial capex and heavy-manufacturing activity; management also flags customer credit risk.
- •Trade/tariff and input-cost exposure: as a low-margin distributor, MSC cites changes to tariff and trade policy plus commodity, energy and labor-price volatility as direct threats to margin.
- •Controlled-company / governance overhang: the Macomb shareholder suit over the share Reclassification survived a motion to dismiss (denied Nov 14, 2025; MSC appealing), and principal shareholders retain significant influence over Company decisions.
- •Competition and consolidation: aggressive competitor pricing and ongoing consolidation in industrial distribution pressure a business with limited evident pricing power (gross margin roughly flat).
🔍 Accounting Red Flags
- ▲Earnings-to-cash divergence: nine-month net income rose ~21% ($172.0M vs $141.7M) yet operating cash flow FELL to $225.5M from $253.5M, driven by a $38.0M inventory build and a ~$48.3M swing in payables/accrued liabilities (a $40.8M source last year became a $7.5M use).
- ▲One-time, non-operating income boost: Q3 recognized a $5,129 Employee Retention Credit into 'Other income (expense)' as the statute of limitations lapsed — a non-recurring item that padded pre-tax income.
- ▲Off-balance-sheet receivables factoring expanded and fully drawn: the Receivables Purchase Agreement cap was increased $50M to $350M and is now fully utilized, supplying liquidity that flatters reported AR (down to $413.3M) and operating cash flow, at a cost of $11,410 in fees run through Other expense for the nine months.
- ▲Disclosure inconsistency worth reconciling: Note 7 states the remaining 25% noncontrolling-interest buyout was 'completed for nominal consideration,' while the cash flow statement shows $8,195 paid for 'Purchase of noncontrolling interest.'
💰 Cash Flow Quality
Still a substantial cash generator whose free cash flow covers the dividend, but conversion deteriorated this year as working capital reversed and short-term financing tools did some of the lifting.
- •Operating cash flow declined ~11% year-over-year to $225.5M even as net income climbed ~21%.
- •Working capital was the drag: inventories consumed $38.0M and accounts payable/accrued liabilities consumed $7.5M (versus a $40.8M source in the prior-year period).
- •Free cash flow (OCF less $64.1M capex) of ~$161.4M still exceeded the $145.8M of dividends paid, but the cushion is thin and buybacks were cut to $13.9M from $39.1M.
- •Cash taxes paid jumped to $58.8M from $35.4M, and the prior-year period had also benefited from $30.3M of property-sale proceeds (in investing) that did not recur.
🏰 Competitive Position
A leading North American industrial distributor with scale and sticky programmatic relationships, but operating in a competitive, low-margin, consolidating channel with limited pricing power.
- +Scale and breadth as a leading North American distributor across metalworking, MRO, Class C Consumables and OEM categories.
- +Sticky national-account and public-sector relationships (Fortune 1000 companies, GSA, DoD, USMC, VA hospitals) that raise switching costs.
- +Diversified end-markets and customer base insulating against single-customer loss.
- -Roughly flat gross margin (~41%) suggests limited pricing power in a price-competitive channel.
- -Heavy exposure (58%) to cyclical Manufacturing Heavy demand.
- -Reliance on short-term uncommitted funding and a fully-drawn receivables-sale program for working-capital liquidity.
- -Structural competition from larger and specialty rivals across industrial distribution and e-commerce.
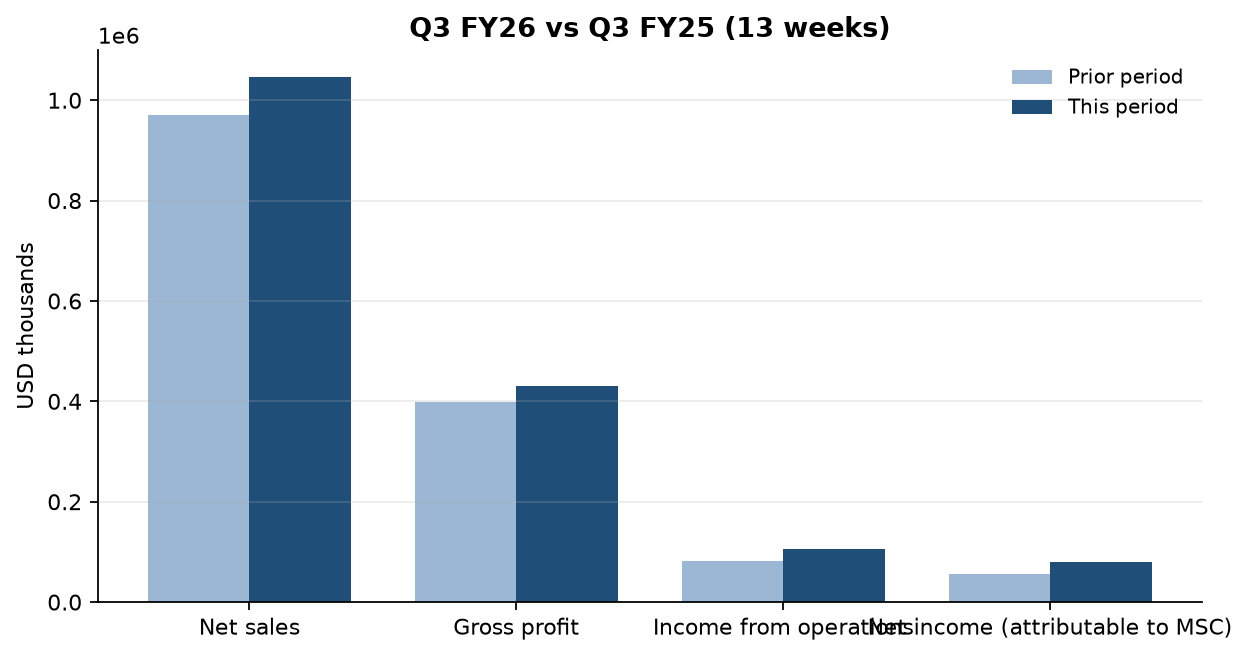
On the tape it reads like a clean cyclical turn. Q3 net sales rose about 8% to $1.05B, income from operations jumped 29% to $106.7M, and diluted EPS leapt 41% to $1.44 — the kind of print that says industrial-distribution demand is re-accelerating for MSC and operating leverage is kicking in.
Follow the cash, though, and the story thins. For the thirty-nine weeks, net income climbed roughly 21% to $172.0M, yet cash from operations actually fell to $225.5M from $253.5M — because a $38.0M inventory build and a ~$48M reversal in payables and accrued liabilities (a $40.8M source of cash last year turned into a $7.5M use this year) drained the earnings gain. At the same time, near-term liquidity leaned on scaffolding that is unlikely to repeat: the off-balance-sheet receivables program was enlarged by $50M to $350M and fully drawn, and a one-time $5.1M Employee Retention Credit padded Q3's 'other income' as the statute of limitations lapsed.
In plain English, MSC earned more but converted less of it to cash — and it is funding a $145.8M dividend and $64.1M of capex against a balance sheet that has grown top-heavy with short-dated debt. Current debt now stands at $417.2M, including $217M of uncommitted facilities that lenders are free to decline to renew and $100M of notes maturing just weeks after quarter-end, versus only $74.1M of cash on hand.
The one thing to watch is Q4 cash conversion. If inventory normalizes and payables rebuild, operating cash flow should snap back and the quarter will look as strong as the EPS line implies; if end-demand softens instead, that inventory becomes dead weight precisely as the July 2026 notes and the uncommitted lines come up for refinancing.
Want this on every stock you own?
Run instant AI analysis of any 10-K or 10-Q from EDGAR — major risks, red flags, cash flow quality, and moat — with Value of Stock Premium.
This analysis is generated from the filing text and is for educational purposes only — not financial advice. Always do your own research before investing.