Micron $MU Prints an 85%-Margin Blowout — But Nearly All of Its Record $28B Profit Is Sitting in Receivables, Not Cash
The quarter looks like a structural AI re-rating (85% gross margin, take-or-pay contracts), but it reads like a textbook cyclical peak — the tell is that nearly all of the record profit is sitting in a near-quadrupled receivables balance rather than in cash, and the only direction from 85% DRAM margins is down as rivals add supply.
MU
10-QCautiousMicron Technology, Inc.
The quarter looks like a structural AI re-rating (85% gross margin, take-or-pay contracts), but it reads like a textbook cyclical peak — the tell is that nearly all of the record profit is sitting in a near-quadrupled receivables balance rather than in cash, and the only direction from 85% DRAM margins is down as rivals add supply.
⚠ Major Risks
- •Extreme cyclicality at a peak: DRAM-led gross margin jumped from 37.7% to 84.6% year-over-year on a pricing surge — margins this high invite competitor supply additions and a downcycle.
- •Demand concentration in a handful of AI/hyperscale customers via newly signed multi-year take-or-pay agreements; the filing flags a customer-concentration risk tied to an undisclosed major customer.
- •Broad IP litigation overhang: a Netlist jury verdict of $425M + $20M (under appeal, with PTAB findings of unpatentability also on appeal) and a wave of YMTC patent suits across the U.S., China, Germany, and the UK that, per the filing, pertain to substantially all of Micron's DRAM/NAND revenue, including injunction risk in China.
- •Capital intensity and execution risk: $19.6B of nine-month capex, surging construction-in-progress ($10.9B) and fab expansion (Clay NY, Singapore, the $1.8B Powerchip Taiwan fab) dependent on CHIPS Act and Singapore incentives that can be reduced, recaptured, or terminated.
- •Tax and geopolitical exposure: the 15% Pillar Two minimum tax now largely offsets Singapore incentives (effective rate up to 15.0%), OBBBA impact is 'uncertain,' and tariffs/trade and China CAC restrictions remain open risks.
🔍 Accounting Red Flags
- ▲Receivables ballooned to $31.0B (trade receivables $26.9B, nearly 4x the $7.2B at fiscal year-end), a ~$20B operating-cash drag that nearly fully offsets nine-month net income — revenue is being recognized well ahead of cash collection.
- ▲'Consideration payable to customers' (a price-adjustment/returns contra-revenue reserve) rose to $3.32B from $1.19B — an estimate-dependent line that typically moves first when pricing rolls over.
- ▲Income taxes payable parked in other noncurrent liabilities jumped to $5.79B from $648M, an unpaid-tax accrual that flatters operating cash flow through timing.
💰 Cash Flow Quality
Nine-month operating cash flow of $45.7B and roughly $26B of free cash flow (after $19.6B capex) funded a full deleveraging to a net-cash position, though the conversion is flattered by a $5B+ deferred-tax accrual and dragged by a ~$20B receivables build.
- •Operating cash flow of $45,702M vs $11,795M a year ago; capex of $19,602M leaves ~$26B free cash flow.
- •Receivables consumed $19,953M of operating cash; other noncurrent liabilities (largely income taxes payable) added $5,203M and other current liabilities $2,139M.
- •Used cash to repay $9,380M of debt and repurchase $650M of stock; ended with $24,995M cash and short/long-term investments of $5,133M against total debt of $5,722M (net cash).
🏰 Competitive Position
Memory remains a commodity oligopoly; Micron's edge in HBM and leading-edge DRAM plus extreme capital intensity confers a real but cycle- and technology-dependent advantage rather than a durable moat.
- +AI/data-center demand surge: CMBU (HBM/hyperscale) revenue of $13.8B at an ~83% gross margin in the quarter.
- +Scale across DRAM ($31.3B quarterly revenue) and NAND ($9.9B), with finished-goods inventory drawn down to $621M, signaling tight supply.
- +Net-cash balance sheet after repaying ~$9.4B of debt, plus a multi-year take-or-pay backlog (~$5B remaining performance obligations).
- -Commodity-pricing cyclicality — the same dynamic that drove margins from 38% to 85% can reverse.
- -Reliance on a few large AI customers and an undisclosed concentration customer.
- -Heavy, ongoing capex and incentive dependence; broad IP-litigation and China/geopolitical exposure.
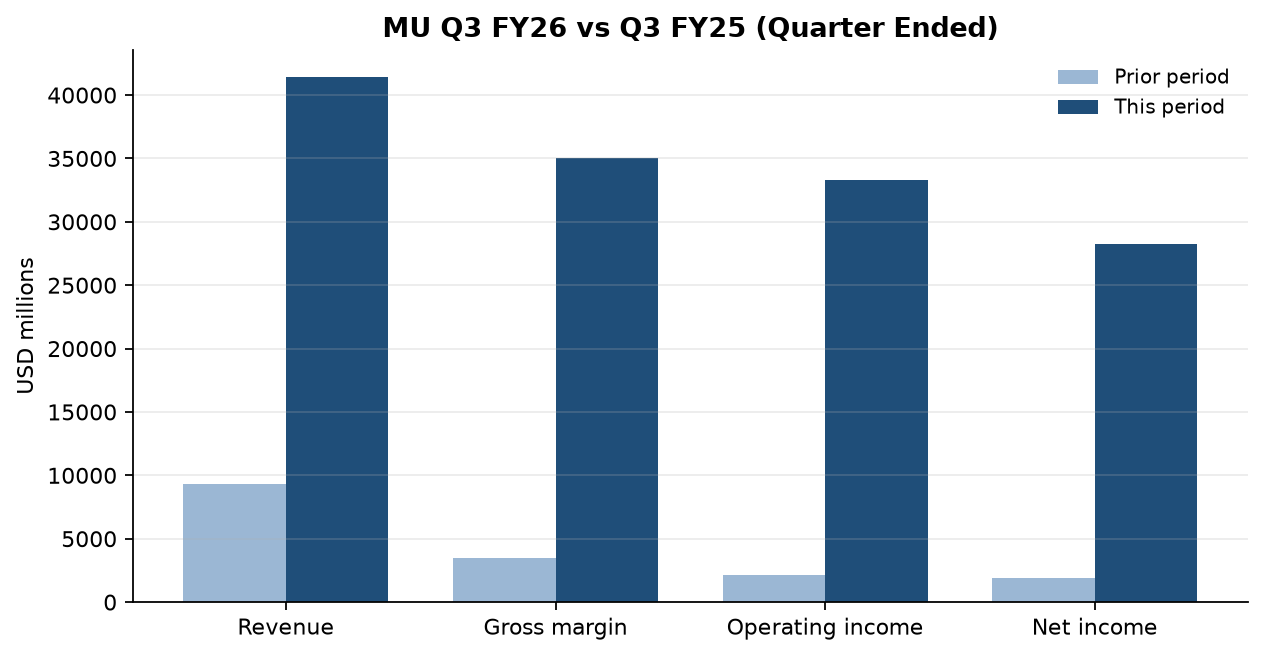
The consensus read writes itself: Micron just printed the best quarter in its history — revenue up roughly 4.5x year-over-year to $41.5B, gross margin of ~85%, net income of $28.2B and diluted EPS of $24.67 — and the multi-year take-or-pay agreements with AI customers will be framed as proof that HBM has structurally re-rated a former boom-bust commodity into a secular grower.
But the mechanism the balance sheet actually implies is the oldest one in semiconductors. Gross margin swung from 38% to 85% in twelve months not because the franchise got durably better, but because memory pricing went vertical in a shortage — and 85% gross margins are an open invitation for Samsung and SK Hynix to add capacity. The tell is in working capital: of the $47B in nine-month net income, about $20B never became cash and instead sits in a near-quadrupled receivables balance, while finished-goods inventory has been drawn down to just $621M — the signature of a company selling everything it can make at the top of a cycle, not one compounding a durable advantage.
In plain English, Micron is playing the cyclical peak correctly: it used the windfall to retire ~$9.4B of debt and now sits in a net-cash position, which is exactly the posture you want heading into the back half of a cycle. The take-or-pay deals — mostly fixed or price-banded across ~$5B of remaining obligations — are the one genuinely new structural feature and could blunt the next downturn, or simply lock in today's volumes at tomorrow's lower prices.
What to watch: the pricing structure and duration of those strategic agreements, the $3.3B 'consideration payable to customers' reserve (the contra-revenue line that moves first when pricing softens), and whether next quarter's receivables convert to cash. The moment DRAM gross margin starts compressing off this 85% peak, the structural re-rating thesis gets tested fast.
Want this on every stock you own?
Run instant AI analysis of any 10-K or 10-Q from EDGAR — major risks, red flags, cash flow quality, and moat — with Value of Stock Premium.
This analysis is generated from the filing text and is for educational purposes only — not financial advice. Always do your own research before investing.